Services

Inquisigen Consulting Inc. offers a variety of bioinformatic and computational biology services, outlined in the catalog below. All services use combinations of in-house and open-source software, and are further customizable.

What’s in a contract?

First and foremost, every contract includes consistent and thorough communication via scheduled meetings to ensure that your needs are met.

Build-your-own service package

Choose from any of the services listed on this page. Services may be combined and/or customized. You may also opt for partial services, as needed.

Book a consultation

The default package

By default, in addition to the selected service(s), all contracts include:

  • A report detailing all methods used and the results obtained.
  • Publication-quality figures in the format of your choice (pdf/svg/eps/png/jpeg). Design may be customized upon request.
  • Processed data tables (csv/tsv) that can be used to reproduce the figures.
  • Code and environment used to analyze/model data, as a private GitHub repository.
  • Temporary storage of your private raw data from the start date of your contract up to 2 months after completion of the contract (if applicable).

You may choose to opt out of any of the above before signing your contract. However, note that this choice is permanent and cannot be changed after completion of the contract.

Cost

The total price of each contract will depend on the quantity of input data, the depth of analysis, the number of meetings, and the time required to fulfill the contract. Projects may be partitioned into multiple contracts to allow for flexibility.

Security and confidentiality

Your private data are guaranteed to be stored and handled securely. Further, any new findings derived via our services or revealed to Inquisigen Consulting Inc. in association with a contract will be held in confidence.
Privacy policy

All services

Whether you need your raw data processed using our compute resources or you need a processing pipeline deployed on your own server, we have you covered.

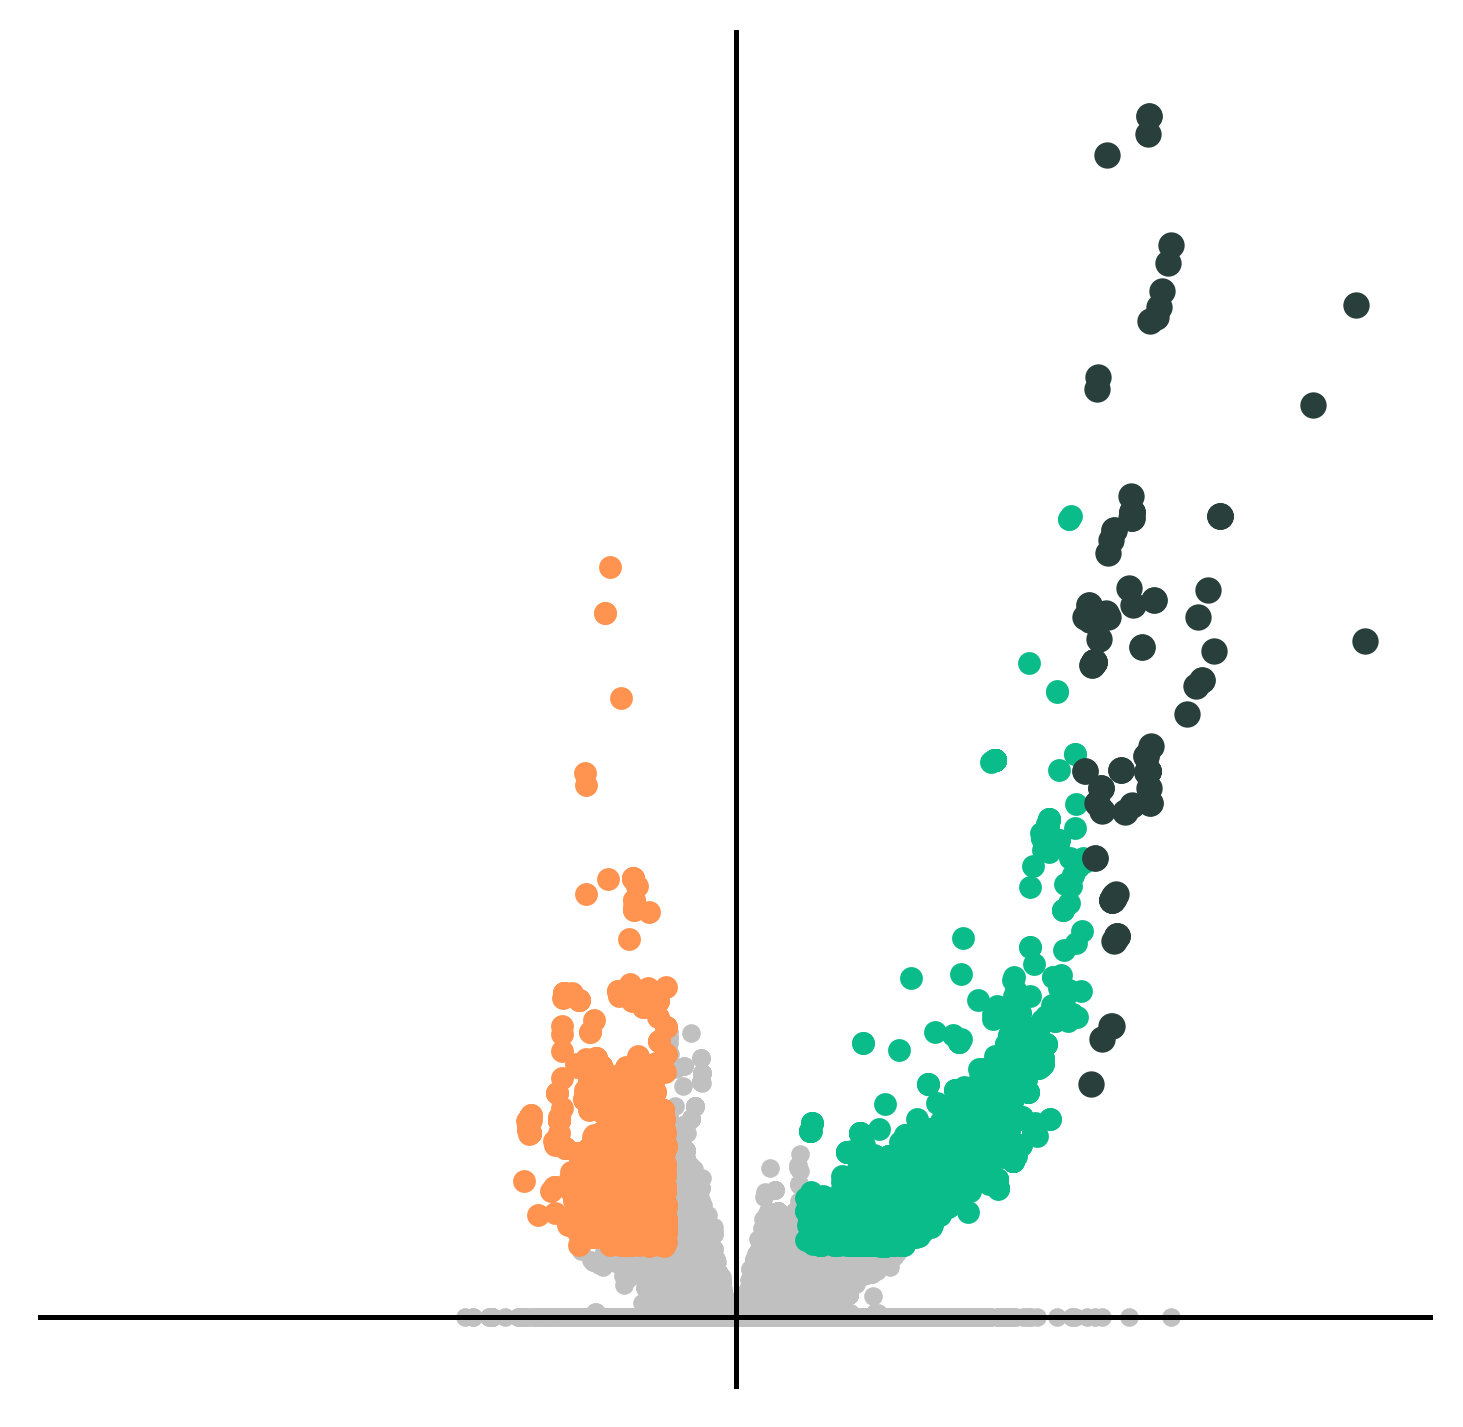
Find differentially expressed genes, compute gene set enrichment, and predict transcript isoform distributions.

Couple this service with gene regulatory network inference or custom modelling to obtain deeper insights.

Cluster cells, annotate cell types, model trajectories, compare phenotypes, and infer cell-cell communication.

Couple this service with gene regulatory network inference or custom modelling to obtain deeper insights.

Deconvolute cell types, model changes in gene expression as a function of distance, and uncover transcriptional programs induced by proximity or direct cell-cell interactions.

Measure transcription using precise alternative approaches such as CAGE-seq and PRO-seq. These are highly useful when the common RNA-seq approach cannot reveal subtle features, such as pausing, enhancer RNAs, and alternative transcription start sites.

Locate accessible chromatin (ATAC-seq/DNase-seq), assess epigenetic states (histone ChIP-seq), or map transcription factor binding (TF ChIP-seq).

Annotate epigenetic marks using nearby genes, find differential binding or chromatin state patterns, and perform motif analysis.

Couple this service with DNA sequence modelling to obtain deeper insights.

Whether you have bulk or single-cell data, coupling transcriptomic and epigenomic data analysis will yield comprehensive insights.

Relate gene expression to chromatin states and other features to gain a more complete picture of any biological process.

Analyze clonal expansion of lymphocytes and find important rearrangements for antigen/peptide recognition and effective activation of immune responses.

Leverage high-throughput parallel perturbation experiments for causal inference of gene regulation.

Reconstruct gene regulatory networks and use knowledge graphs to obtain testable inferences from your data.

Find sequence determinants of TF binding and chromatin accessibility. Generate testable hypotheses for follow-up studies.

Request any other type of modelling or tool. We are eager to work on virtually any applied machine learning project involving biological data.

Details

NGS data processing

Quality control, mapping, and filtering of sequencing reads. Perform demultiplexing if needed. For transcriptomic data, obtain raw gene expression counts. For epigenomic data, perform peak calling and annotation.

Follow-up with analyses specific to your data type(s) below.

data-processing

Bulk RNA-seq analysis

Find differentially expressed genes using the tool of your choice. We recommend selecting one of:

Compute gene set enrichment with classical Fisher’s exact tests against a comprehensive set of ontologies/pathways (GO, KEGG, Reactome, STRING, etc.), or opt for a public tool such as:

Perform principal components analysis (PCA) and clustering to visualize and represent high-level differences between biological samples.

For long-read RNA-seq data, quantify transcript isoforms with the latest state-of-the-art tool:

Specialized analysis for time series RNA-seq data is also possible using tools such as:

differential-expression
Source data: Pahl et al. eLife 2024

Further reading

Rosati et al. Differential gene expression analysis pipelines and bioinformatic tools for the identification of specific biomarkers: A review. Comput Struct Biotechnol J. 23 (2024)

Single-cell RNA-seq analysis

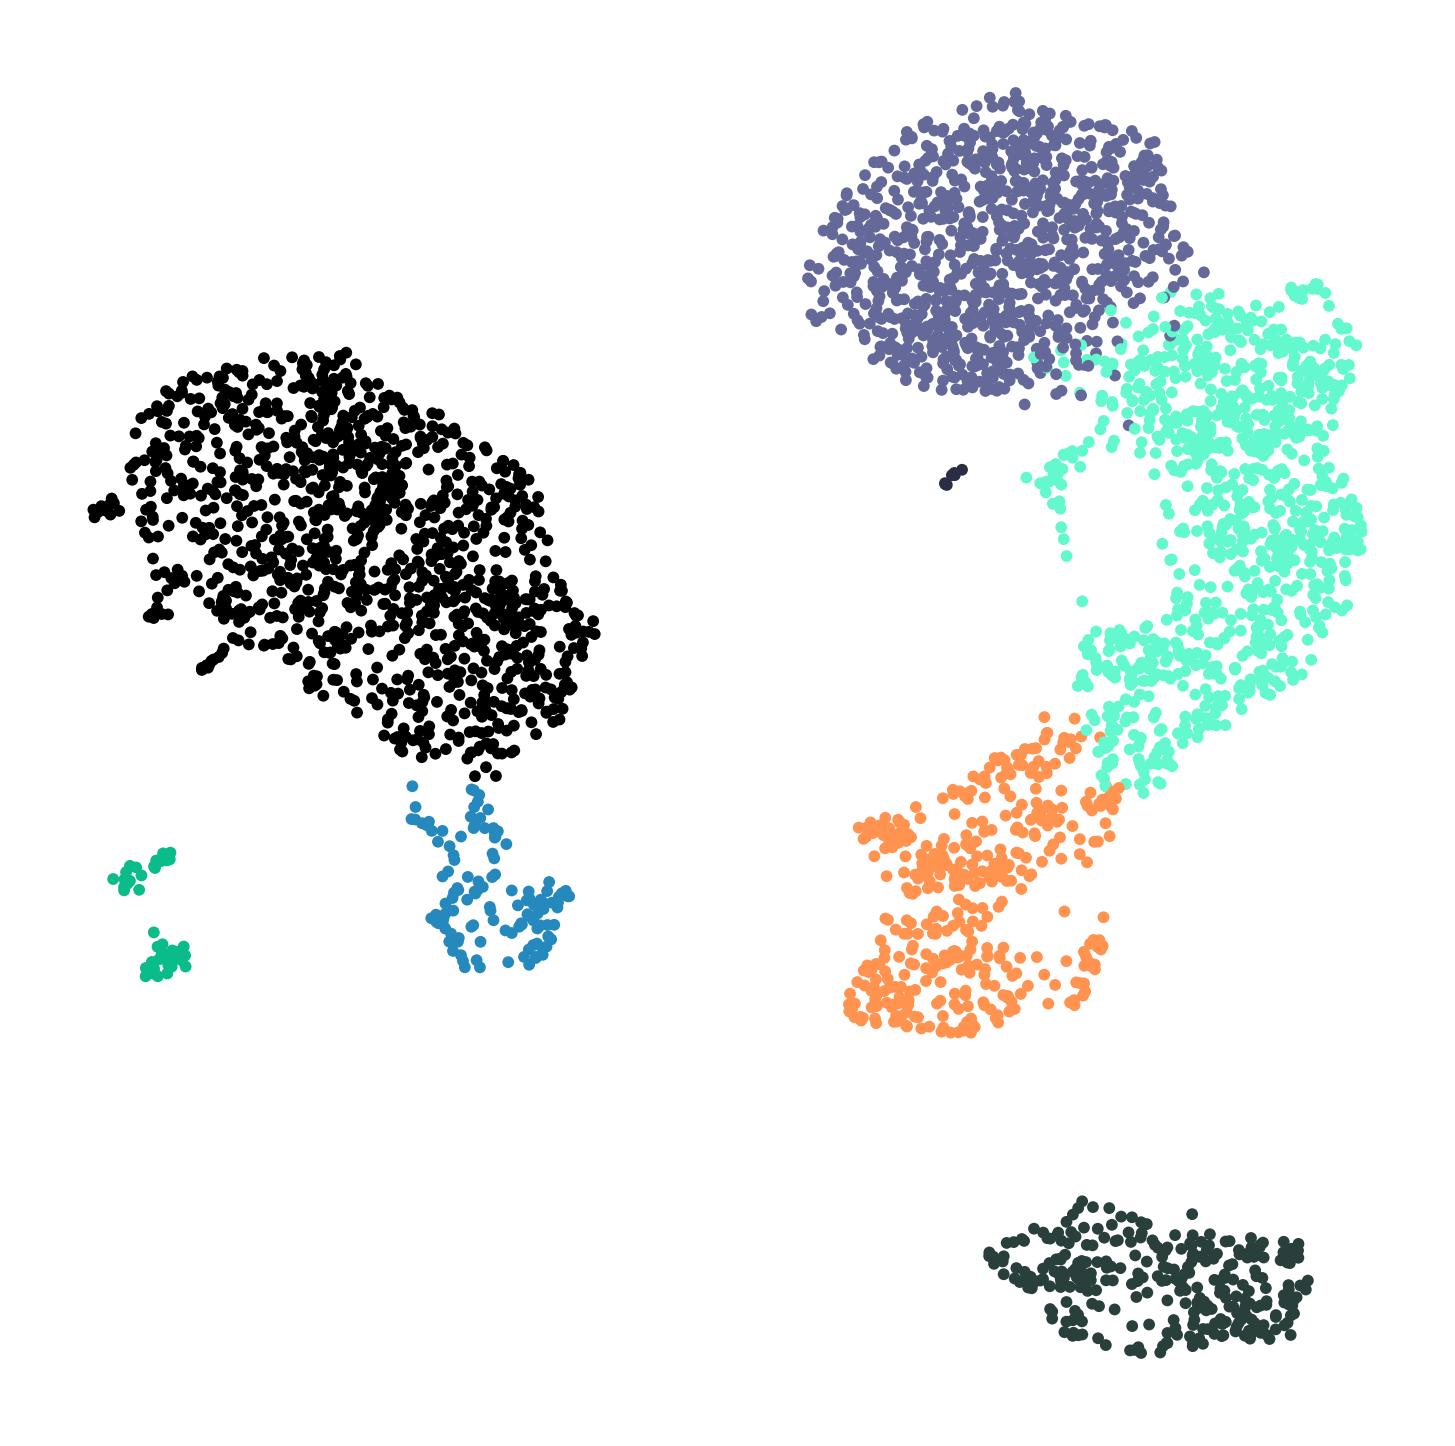
Cluster cells, annotate cell types, model trajectories, compare phenotypes, and infer cell-cell communication.

For single-cell analyses, we use libraries in the Python scverse ecosystem. For scRNA-seq processing, we begin with functions built into Scanpy for dimensionality reduction (UMAP) and clustering (Leiden).

Cells may be annotated manually, with an automated tool, or using reference datasets.

Infer cell-cell communication with:

Source data: 10x Genomics

Spatial RNA-seq analysis

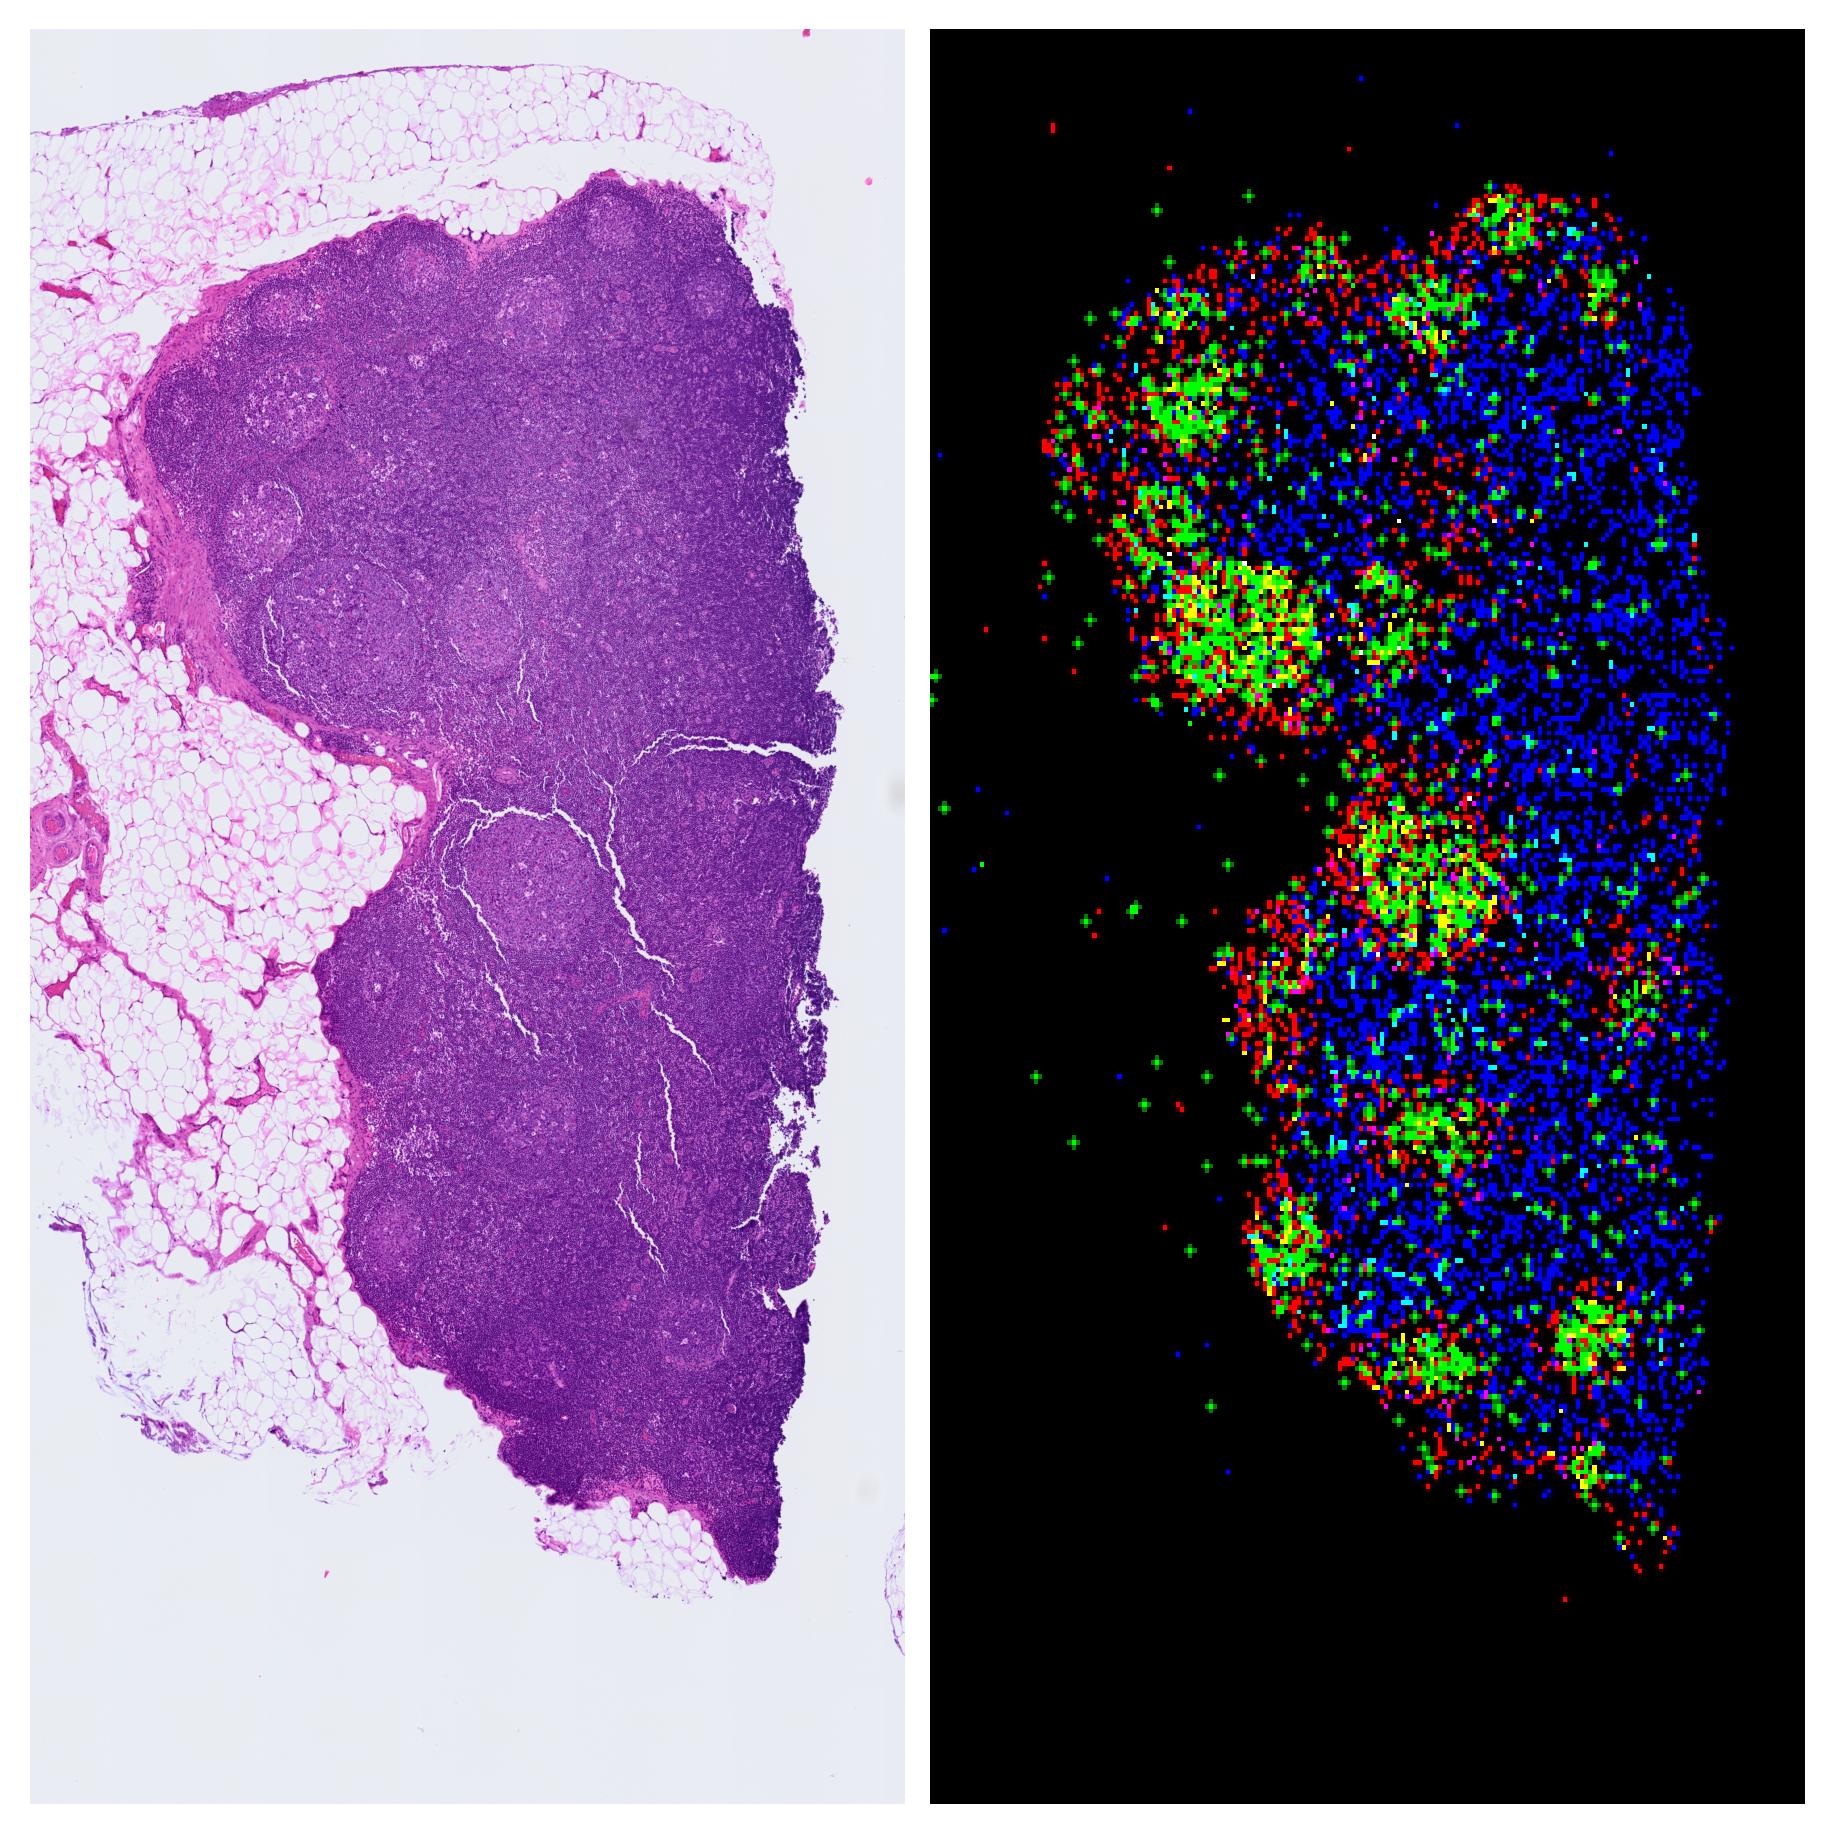
For technologies like 10x Genomics Visium (large spots) and Visium HD (single-cell resolution) and Xenium Prime 5K (subcellular resolution).

See more on the official 10x Genomics website

spatial-transcriptomics
Source data: 10x Genomics

Other transcriptomic analysis

CAGE-seq analysis

Quantify the transcription of all capped RNAs, discover enhancer RNAs, and map alternative transcription start site usage in specific biological contexts. This method is better suited to transcription factor binding inference and DNA language modelling for the selection candidate upstream regulators, compared to RNA-seq.

See the official CAGE-seq website

PRO-seq analysis

PRO-seq is highly useful for precisely mapping RNA polymerase in action. It can also reveal the half-lives of mRNA molecules, which is an important, often overlooked method of transcriptional regulation.

Epigenomic data analysis

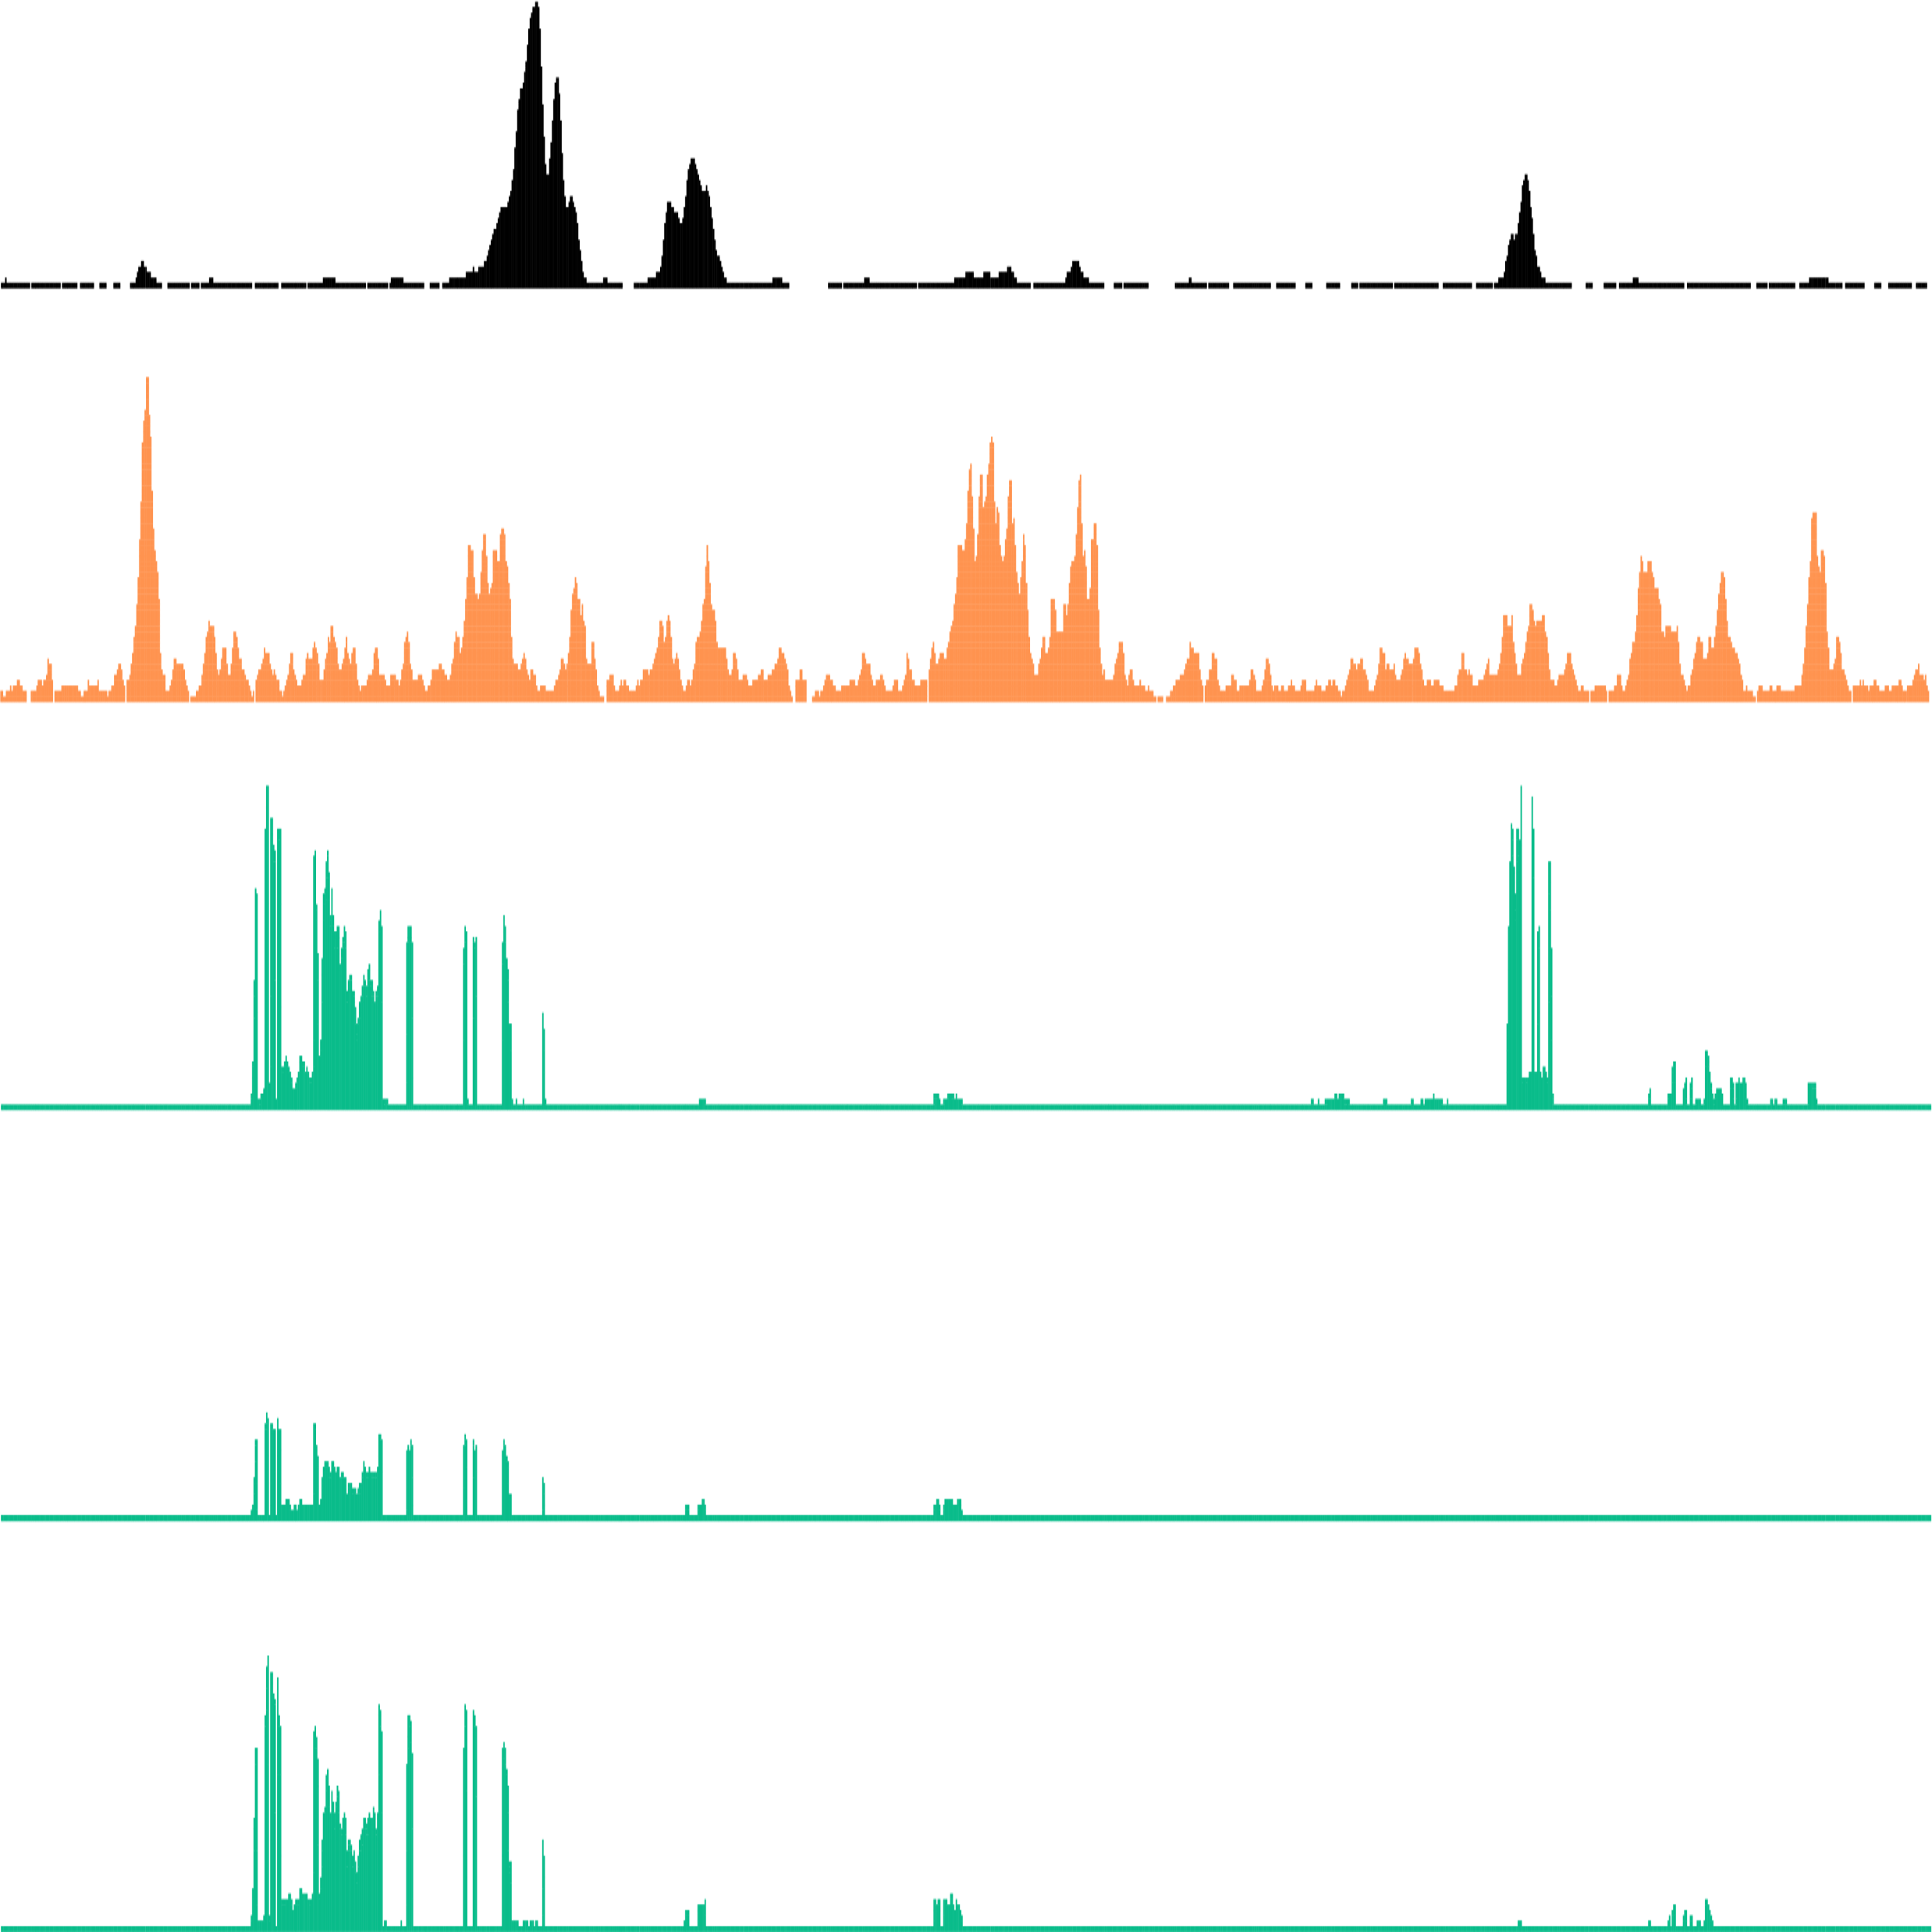
ATAC-seq/DNase-seq

Find accessible chromatin and find potential TF sets driving accessibility and transcriptional activity.

Transcription factor ChIP-seq

Specifically map the binding of a transcription factor to find differential activity between biological phenotypes.

Histone mark ChIP-seq

Survey the subtleties of the epigenomic landscape by measuring histone modifications.

epigenomic-tracks
Source data: ENCODE & GTEx

Multi-omic analysis

Find relationships between chromatin state and gene expression.

See also: multi-modal networks

TCR/BCR-seq analysis

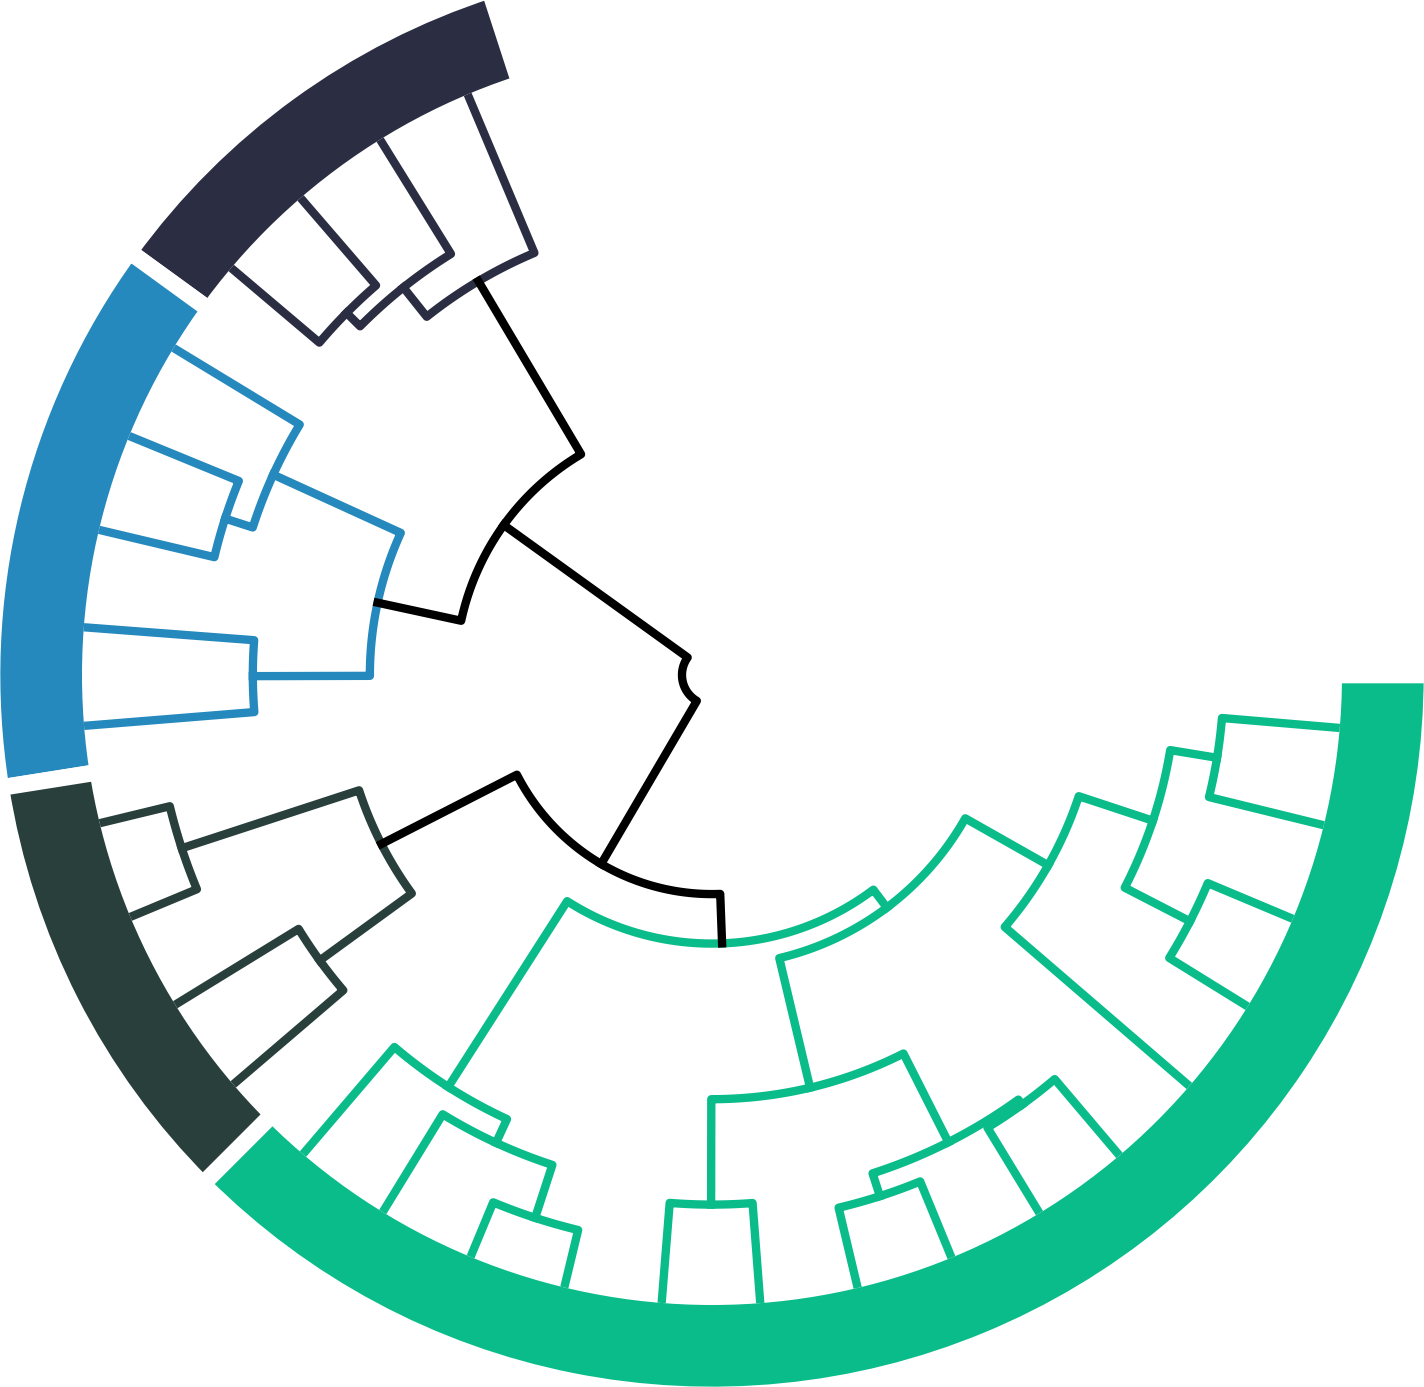
Measure clonal expansion of lymphocytes, and examine their development. Calculate TCR/BCR repertoire diversity and overlap between samples. Track clonotypes and build phylogenetic trees.

When coupled with transcriptomics, gene rearrangements required for antigen/peptide recognition and activation of immune responses can also be revealed.

tcr-bcr-phylogeny

Perturb-seq analysis

Quantify regulatory relationships empirically using systematic perturbation experiments.

Further reading

Yao, D., Binan, L., Bezney, J. et al. Scalable genetic screening for regulatory circuits using compressed Perturb-seq. Nature Biotechnology 42, 1282–1295 (2024).

Network inference

Gene-regulatory networks

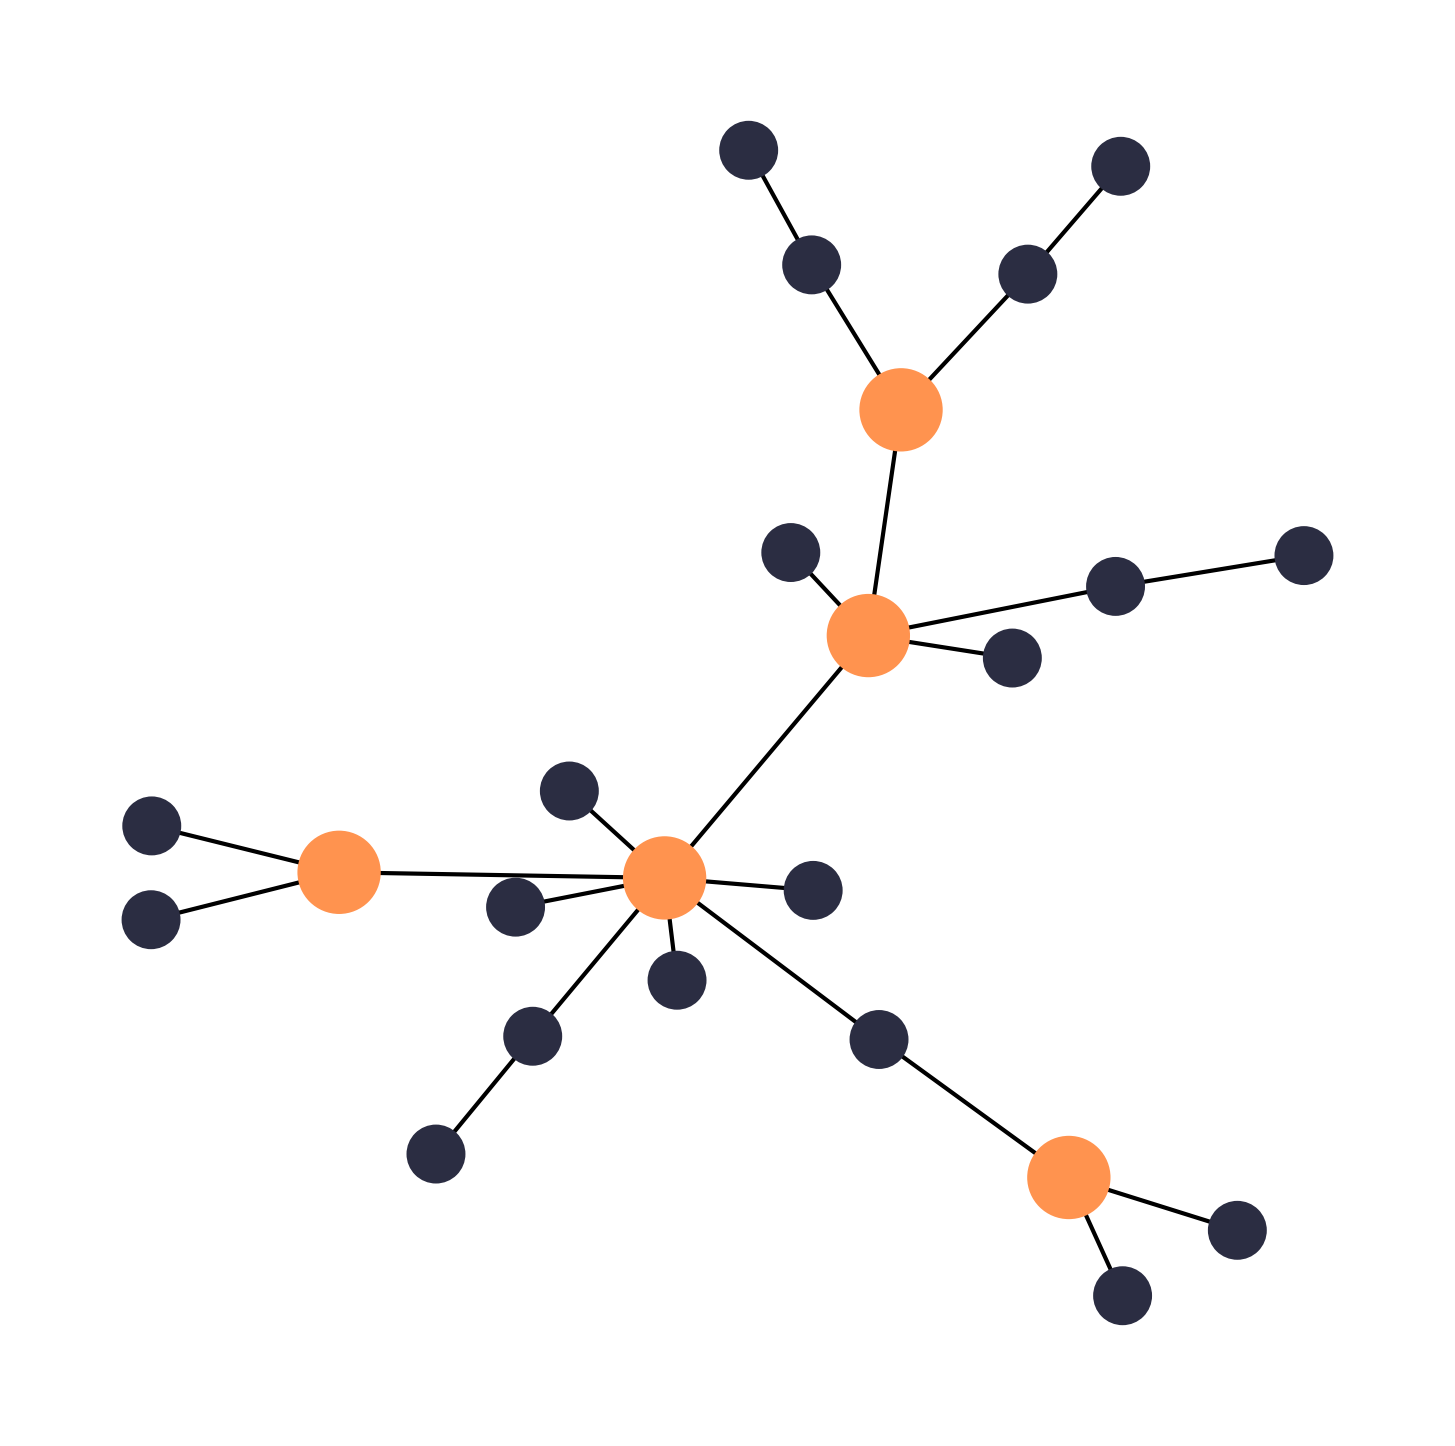
Infer networks between genes, including upstream regulators such as TFs, and their potential causal effects with respect to biological phenotypes or disease. Examine co-regulated pathways and find out how they fit into the bigger picture.

Multi-modal networks

Construct heterogeneous networks using multiple data modalities.

Knowledge networks

Take entire databases of different modalities into account to learn about connected biological pathways beyond your own data.

network

Further reading

Zitnik et al. Current and future directions in network biology. Bioinformatics Advances 4, 1, vbae099 (2024).

DNA sequence modelling

DNA motif analysis

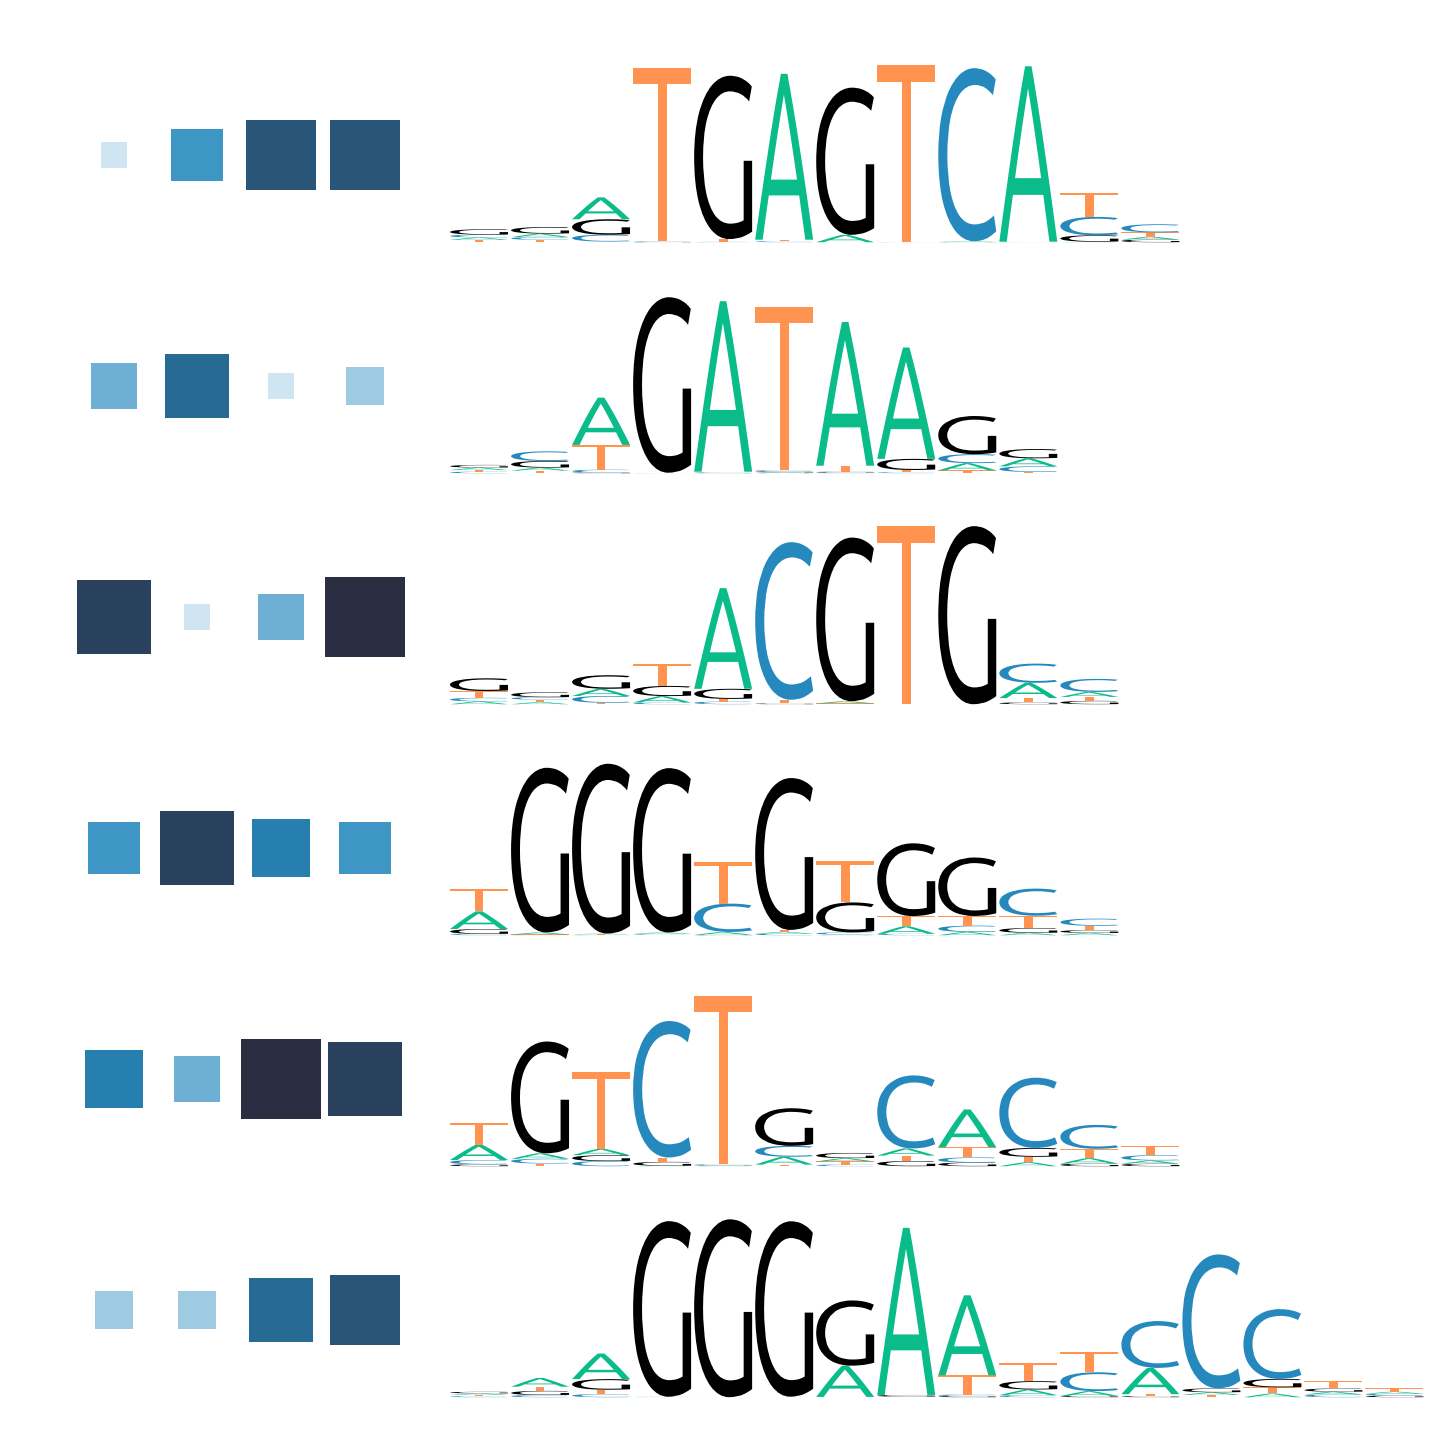
Obtain candidate TFs regulating chromatin state or gene expression via:

  • Global motif enrichment analysis
    • HOMER, AME, etc.
  • Differential motif enrichment analysis
    • monaLisa

DNA language modelling with neural networks

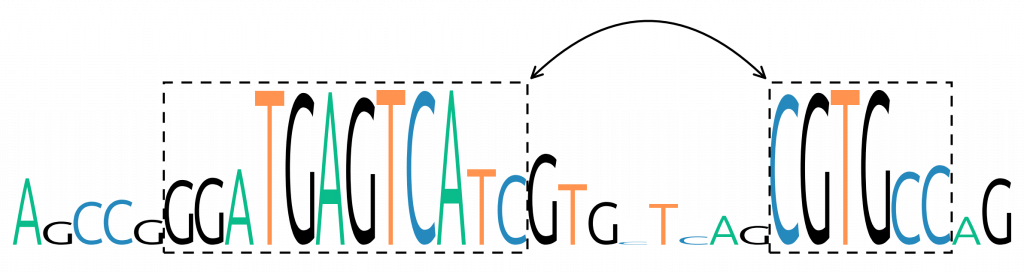
Find sequence determinants of TF binding using state-of-the-art DNA language models.

Answer questions like: which other TFs cooperate with the target TF?